
Communications And Data Storytelling
Data is an integral part of almost any industry. Advertising executives use data to determine which ads to run and on which platform. Legal experts use data to choose jury members. The truth is, data is all around us. According to a report by Deloitte Access Economists, 76% of businesses have plans to increase their spending on their data analytic capabilities. However, no one will pay attention if you don’t know how to communicate the data in a compelling and interesting way. This is why learning how to communicate data using storytelling is so important.
 Our CEO and Founder, Jessica Chen, recently hosted a Soulcast Media | LIVE event on LinkedIn. She interviewed data storytelling expert at Beehive Media, Bill Shander.
They shared tips and personal stories about communications and data storytelling.

Data Storytelling
During the Soulcast Media | LIVE, Jessica asked Bill, how do you take data and communicate it so people can understand? Bill explained how he has come up with several key things necessary to present data, so it doesn’t overwhelm you or the audience you are speaking with.
1. Your Focus
It can be challenging to know where to start if you have a giant pile of data. You need to have a focus point. When you narrow down your focus, you can begin to create a narrative for your audience. During the Soulcast Media | LIVE, Bill shared three critical steps to help you narrow your focus.
Consider the following:
- Know what your data is saying – To communicate data effectively, you have to understand your data. For example, let’s say you are conducting a poll of 1,000 people. You may have a lot of data from your poll, such as gender, age, eye color, etc. However, it would be best if you focused on what your poll is actually about. The other data might be interesting, but it isn’t essential for your study.
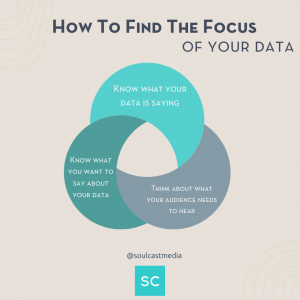
- What your audience needs to hear – Who is your audience? Your audience will determine what data you need to present. For example, if you are presenting data about people’s favorite cereal to the marketing department, they will want to know the ages of the participants. This is because the way they create their marketing campaigns will be largely based on the ages of their audience. Your focus could leave this information out, which is why it is always important to know what your audience needs to hear.
- Know what you want to say – What you want to say about the data can often be considered the “so what?”. In other words, why is your data important? For example, suppose your data shows 80% of people polled prefer strawberry ice cream over vanilla. In that case, you may want to say it would be best if the production of strawberry ice cream increased and the production of vanilla ice cream decreased. What you want to say about the data is why you are presenting it.
You must ensure you think through your focus before presenting your data to your audience.
2. The Story
Once you have the focus of your data, you will need to organize the data into a narrative structure for an audience. In other words, you need to tell a story. As you craft your story, you will want to focus on the flow, important data points, and making sure it is understandable.
Consider the following:
- Flow – A story is a linear experience that flows. The story you tell about the data needs to flow. For example, you could say random words like, green chair, heat, and book, and none of these would make sense, or flow for your audience. However, if you said I sat in the heat in a green chair reading my favorite book. You’ve now put your words into a story that flows. During the Soulcast Media | LIVE, Bill said people automatically resonate with stories, which means it is important to incorporate them into your data presentations.
- Important Data – As you craft your story, you will want to separate the important data from the interesting data. During the Soulcast Media | LIVE, Bill gave an example about ice cream to illustrate this point. He said if you did a survey about ice cream flavors and got data back showing 80% of people who are left-handed preferred Chocolate ice cream, that would be an interesting data point. However, it wouldn’t be an important data point. To ensure your story stays focused, you must include only the important data.
- Understandable – As you organize your data into a story, you want to ensure your story is understandable. In other words, does it make sense? Is it logical? For example, During the Soulcast Media | LIVE, Jessica said one way to communicate data so it is understandable is to pretend like you are talking to your best friend. Your story should be conversational instead of robotic. Otherwise, people will lose interest and not understand what you are trying to say.
The story is how you will communicate your data to your audience.
3. Your Execution
When delivering your presentation of data, you want to ensure your execution is clear, uses compelling visuals, and your data is edited. If your presentation isn’t clear, your audience will get lost, and your data won’t make sense.
Consider the following:
- Clear Communication – When communicating data to an audience, you want to ensure your communication is clear. This means being succinct and to the point. For example, as you write out your presentation, always think about your data’s focus. Ask yourself, what is the main point I am trying to make. When you keep this in mind, you will ensure your presentation is succinct. If you go off on tangents, your point will get lost.
- Use Visuals – Create visuals that are impactful and compelling. For example, if you have a lot of data, but have one piece of data you want the audience to focus on, consider only labeling that data point. You can also highlight that point using a different color, so the audience focuses on what you want them to see and hear. Ensure your visuals are exciting and convey what you want them to know about the data.
- Editing Your Data – You must edit your data when preparing for a presentation. You will want to expand only as much as you absolutely must. For example, during the Soulcast Media | LIVE, Bill talked about how you could have a thousand data points from one survey. However, you don’t have enough time during your presentation to talk about each and every one. Edit it down to only the most important pieces of data. This way, you will keep your presentation concise and focused.
Step back from the numbers and remember your presentation needs to be about what the numbers mean.
Data storytelling is something you can learn. Human beings are wired for storytelling. The more you use storytelling to communicate data, the more easily your audience can remember the data.
Check out Jessica’s Youtube Channel if you want to see the full version of this LIVE.
__
Whenever you’re ready, there are 3 ways we can help you:
- Discover your communications style so you know where to start. Over 4,000 people have found theirs here.
- Attend our monthly communication workshop to build communications confidence (new topics: public speaking, advocating for yourself, building credibility, etc) here.
- Get your brand in front of 43k+ people by sponsoring our newsletter or Soulcast Media | LIVE LinkedIn events [contact: hello@soulcastmedia.com]